European defense stocks 2026 broke apart into two very different groups inside the same basket. Rheinmetall traded at €2,008 on March 3. Today it trades at €1,495, a 25% fall from peak in seven weeks. Saab is down 19% from its January high. Hensoldt is 30% off its peak. Dassault and Thales are both 11% below their own recent highs.
Over the same window, BAE Systems hit a new 52-week high and is up 31.6% year to date. Leonardo is up 30.4% and is trading near its 52-week high too. Same sector, same tailwinds, same quarter. The spread between the worst and the best performer inside the European defense basket is now close to 60 percentage points.
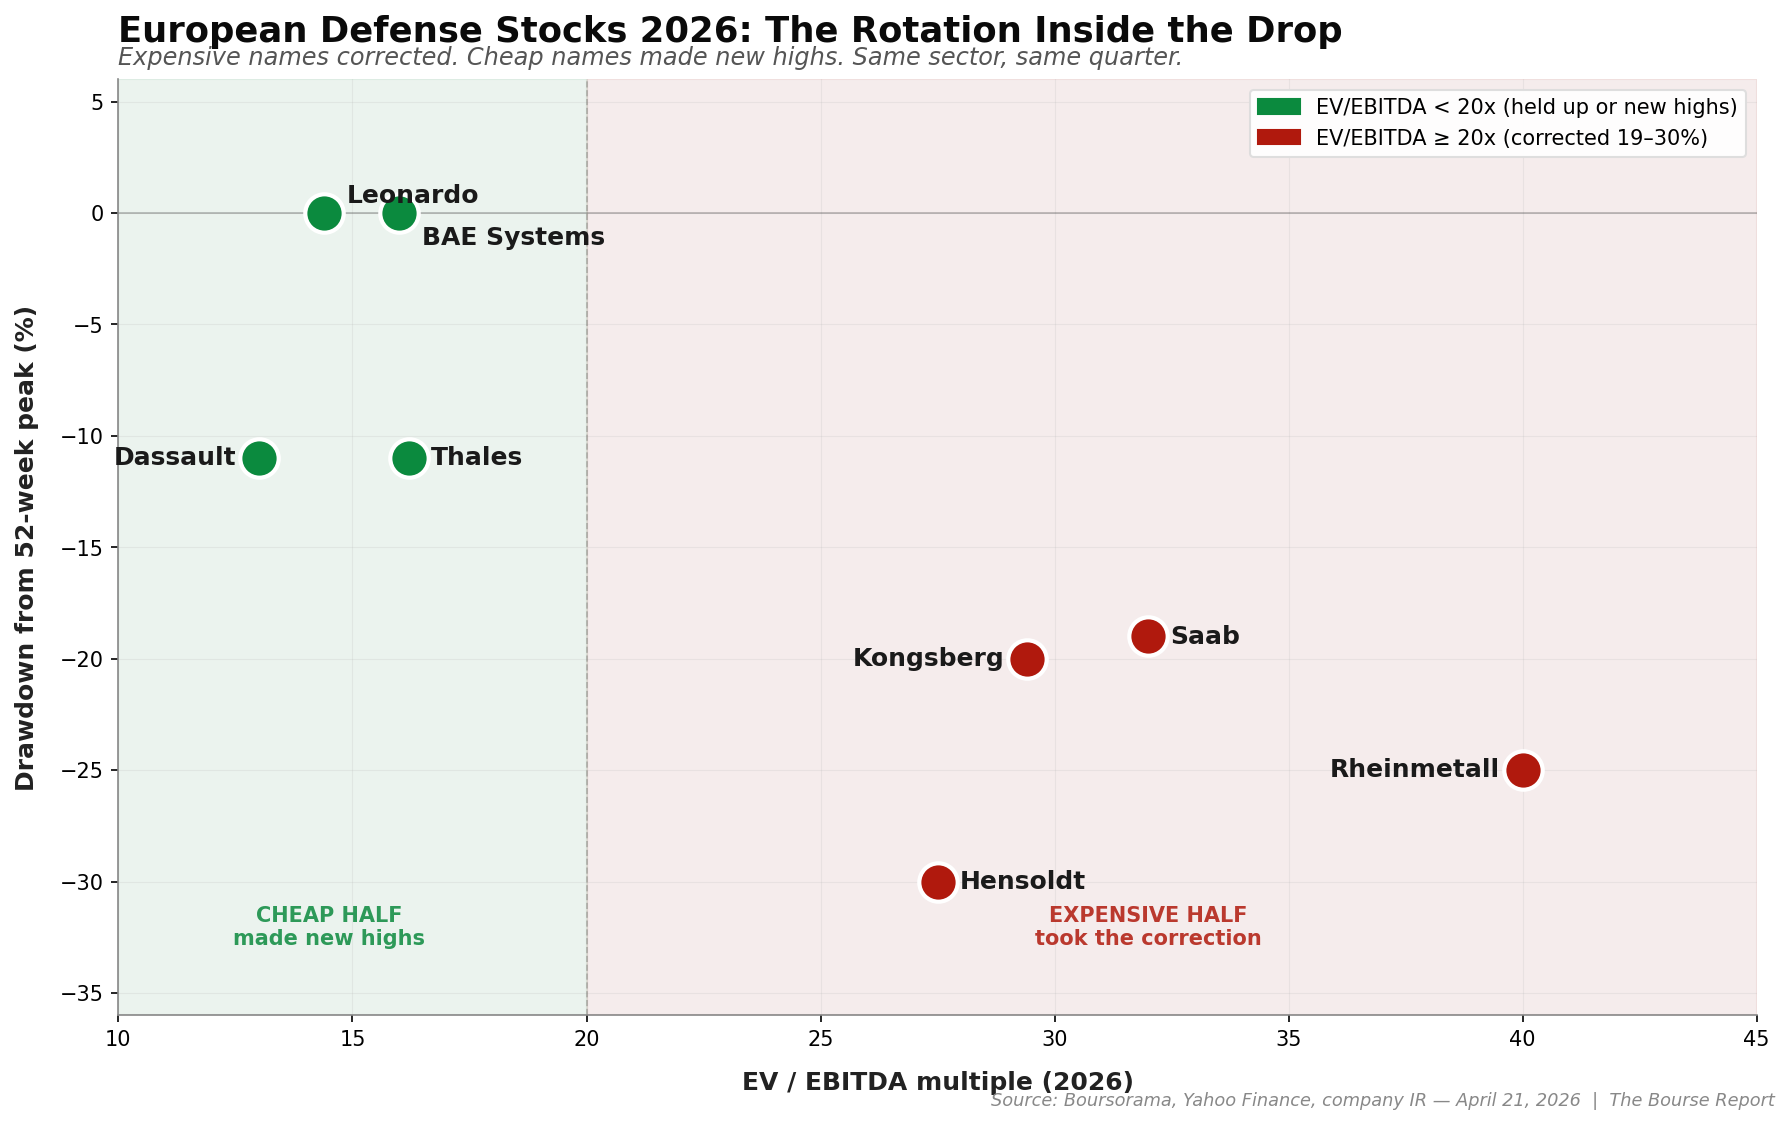
The story in the press is that European defense stocks “corrected” in March. That framing is lazy. What happened is a surgical rotation. The market sold the expensive names with the biggest 2024-25 rallies, and kept buying the cheaper names with direct exposure to the parts of defense spending that are now accelerating: sensors, electronics, missiles, counter-drone systems. That dispersion, not the headline direction, is the only thing worth trading in this sector right now.
My thesis in one sentence: the European defense trade is no longer a beta call, it is a dispersion call, and the map below tells you where the money is already moving.
The one variable that matters: valuation dispersion
Across European defense stocks in 2026, the cheapest name in the basket trades at 14.4x EV/EBITDA. The most expensive trades at roughly 40x. Same sector, same order book story, nearly 3x differential. That is the single number that explains the entire 2026 tape.
Here is what the multiples look like, dated April 21, 2026:
| Name | Ticker | Fwd P/E | EV/EBITDA | Backlog / Rev | YTD 2026 | From 52-wk peak |
|---|---|---|---|---|---|---|
| Leonardo | LDO.MI | ~27x TTM | 14.4x | 2.4x | +30.4% | near high |
| Thales | HO.PA | 24.8x | 16.2x | 1.6x | ~flat | -11% |
| BAE Systems | BA.L | 23.5x | ~16x TTM | 3.0x | +31.6% | at high |
| Hensoldt | HAG.DE | 42-48x | 25-30x | 3.6x | +9.6% | -30% |
| Kongsberg | KOG.OL | ~41x | 29.4x | n/v | ~-6% | -20% |
| Saab | SAAB-B.ST | 46.4x | 30-34x | 2.6x | ~flat | -19% |
| Rheinmetall | RHM.DE | 36-38x | ~40x | 6.4x | +20% | -25% |
| Dassault Av. | AM.PA | 20.6x | n/v | 6.3x | ~flat | -11% |
Two things jump out of that table, and only two.
First, the three cheapest names on EV/EBITDA (Leonardo 14.4x, Thales 16.2x, and BAE on forward P/E 23.5x) are the three names that either held up or made new highs in 2026. The three most expensive names on EV/EBITDA (Saab 30-34x, Hensoldt 25-30x, Rheinmetall ~40x) are the three names that took the biggest hits from their peaks. That is not a coincidence, and it is not a “risk-off” pattern. It is the market re-pricing how much of the structural rearmament story was already in the multiple.
Second, the backlog-to-revenue ratios are not the differentiator. Rheinmetall (6.4x) and Dassault (6.3x) both have enormous order books, and they performed differently. Leonardo (2.4x) has a lower ratio but converted better in 2025 and rallied. The dispersion is not about visibility, it is about what investors are willing to pay for the same visibility.
The pullback was surgical, not sector-wide
If this were a generic sector correction, everything would have fallen together. It did not. The MSCI Europe Aerospace and Defence index fell 9.2% in March, its worst month in five years, and that number is accurate at the index level. But inside the index, the pain concentrated in three specific names, and BAE plus Leonardo ran the other way.
Look at the peak dates. Rheinmetall topped out March 3. Saab topped out January 19. Hensoldt topped out February. In every case, the peak was set before the Iran war ceasefire on April 8 and before the Ukraine deal headlines on April 10. So the correction cannot be blamed on those events. Those events accelerated a move that had already started inside the expensive half of the basket.
The Reuters and Invezz analysis pin the pullback on three overlapping drivers: profit-taking after a parabolic 2024-25, stretched forward multiples (sector peaked at ~29x forward P/E), and a shift in narrative around what “future defense spending” actually buys. The third driver is the one I think matters most, and it is the one that explains why the dispersion came out this way instead of the reverse.
Demand is shifting inside defense, not adding on top
The structural rearmament story is still in place. Every NATO member except Spain signed onto the 5% of GDP target by 2035 at the Hague summit in 2025 (3.5% core defense, 1.5% security-related). Germany’s 2026 defense budget sits at €117.2 billion with a path to €162 billion by 2029. France is at €68.5 billion in 2026 and targeting 3.5% of GDP beyond. Those numbers are not in question.
What changed is where the money goes inside that envelope. The Ukraine war and the Iran war together delivered a lesson that European procurement chiefs now state openly: modern combat is fought with thousands of cheap drones and layered sensor networks, not dozens of expensive legacy platforms. Ukraine burns ~9,000 drones per day. Iran produces ~400 Shahed drones per day. The price per unit on those weapons runs from hundreds to a few thousand euros. That is not a narrative, it is a unit economics fact.
Europe is responding with a specific redistribution. France committed €8.5 billion to multiplying drone and missile stocks by 400% before 2030. Germany committed €10 billion specifically to military drones. The EU launched the European Drone Defence Initiative with over €1 billion of R&D, targeted at a 360-degree counter-drone shield by 2027. Bank of America’s European defense team publicly rotated its top picks toward missile, drone, and counter-drone technology in Q1.
Match that to the company mix. Thales makes defense electronics, radars, missile systems, and cyber. Leonardo owns MBDA through its stake in the missile joint venture, plus helicopters and electronics. Hensoldt makes radar and sensors. Saab makes Gripen fighters (platform) and A26 submarines (platform) but also missiles and electronics. Kongsberg makes strike missiles and naval systems. Rheinmetall is primarily tanks, artillery, ammunition, and vehicles. BAE is a diversified prime with heavy US exposure and strong submarine and air programs.
The names with the highest share of sensors, electronics, missiles, and counter-drone in the mix are the ones that held up. The names most levered to tanks, artillery, and legacy platforms are the ones that corrected. The dispersion is doing exactly what the demand redistribution would predict.
Execution risk is the under-priced problem
The tell that the market has started to doubt the expensive names is not the share price, it is what the companies themselves are guiding.
Rheinmetall’s full-year 2025 results printed sales of €9.9 billion, up 29%, and a record €63.8 billion order backlog, up 36%. Headline results were strong. Then management guided 2026 sales to €14-14.5 billion against analyst consensus of €15 billion. That is a 3-7% miss on the number that was supposed to justify a 40x EV/EBITDA multiple. The stock went from €2,008 to €1,495 in six weeks. That is what a miss looks like when the valuation assumes perfection.
Hensoldt shows the same pattern in more extreme form. Q1 2026 order intake grew 62% to €4.7 billion and backlog crossed €8.8 billion, 3.6x annual revenue. Impressive. Revenue growth in the same quarter was 9.6%. Order-to-revenue conversion is running at roughly one-sixth of the order intake growth rate. At 42-48x forward P/E, the stock needs that gap to close fast. The 30% drawdown from peak says the market is not waiting.
Saab raised its medium-term organic growth target from 18% to 22% after 2025 results. Even so, independent analysts at Seeking Alpha downgraded the stock citing a 60%+ history of missing forecasts at the company, and a 40-50x P/E multiple. When the bear case is structural (company has missed guidance repeatedly in the past) rather than cyclical, the multiple is the weak point.
Leonardo delivered full-year 2025 revenue of €18.6 billion (+9.8%), earnings of €1.22 billion (+14%), and guided for €25 billion of new orders in 2026 against a prior €23.8 billion run-rate. Clean execution, confirmed guidance, and it trades at 14.4x EV/EBITDA. The market is rewarding it with a 30% year-to-date rally and price near 52-week highs.
Execution gap, not geopolitics, is the variable that cracked the premium names. And execution gap is what the dispersion is re-pricing in real time.
What could go wrong
Three scenarios would invalidate the dispersion thesis. I list them in order of probability.
Iran ceasefire breaks and triggers a sector-wide rally. The ceasefire expires April 22. President Trump has called extension “highly unlikely” and Iran seized a US-flagged vessel on April 19-20. The Strait of Hormuz is partially re-blockaded already. If the ceasefire fails and a shooting phase resumes, defense stocks rally together, and the dispersion compresses. The cheap names gain less than the expensive ones in a beta rip, because they started closer to fair value. In that scenario, Rheinmetall, Saab, and Hensoldt could outperform Leonardo and BAE for a few weeks. My thesis would under-perform. I would not change positioning in the first week of that rally, because a breakdown is likely to be short-lived or partial, but I would tighten stops.
Ukraine-Russia reaches a real deal. Ukraine’s top negotiator signalled progress on April 10 and the sector dropped on that single headline. A real deal would cut the Eastern European procurement curve more than an Iran escalation would add. This is a larger risk than Iran because Ukraine is a bigger share of the European order book thesis. If a deal materializes in the next 2-4 weeks, I would expect the entire basket to repair lower, with the cheaper names (Leonardo, Thales, BAE) taking smaller losses because the re-rating room is already gone. In that scenario the dispersion thesis actually holds.
German budget execution slips. The €117.2 billion 2026 defense budget is legal authority, not delivered revenue. If German procurement gets stuck in the Bundeswehr’s historical execution bottleneck, Rheinmetall’s guidance becomes structurally at risk, and a second guidance miss in Q2 or H1 could take the multiple from 40x to 25x. That is a 30-35% downside from here even without any geopolitical event. This is the quiet risk inside the expensive names.
The one scenario I rule out is a sudden re-rating of the cheap names higher. Leonardo at 14.4x EV/EBITDA is already doing the work on its price. BAE at 23.5x forward P/E is fairly priced. The upside from here is earnings growth, not multiple expansion.
My view
I would not buy Rheinmetall here. The 25% drawdown is not the buying opportunity it looks like. It is the market taking down a multiple that was priced for zero execution risk, against a company that just missed its own 2026 guidance. I would revisit below €1,300, or after one clean quarter that proves the €14-14.5 billion guide is deliverable.
I would not chase BAE. +31.6% year to date at a 52-week high, with a forward P/E of 23.5x, is not cheap and not expensive. If you do not already own it, wait for a 10% pullback on any headline, and buy in pieces. It is the single best-run name in the basket and its record £83.6 billion backlog covers almost three years of revenue. For readers outside France, this is the quality core of a defense allocation.
The dispersion trade I do find interesting is long Leonardo and Thales, underweight Rheinmetall and Saab, inside a defense-sector allocation. Leonardo at 14.4x EV/EBITDA is the cheapest pure-play in the basket with the fastest-closing execution gap. Thales at 16.2x with +27% Q1 orders growth and a book-to-bill above 1.0 is the purest play on the electronics, missiles, and sensors pivot. Both are PEA-eligible for French readers.
For a single-name thesis piece, the cleanest call right now is: wait on Rheinmetall, own Leonardo or Thales in a taxable account, and let the dispersion do the work. I would add to positions in both on any 5-8% pullback from here, and I would not touch Rheinmetall until Q2 2026 reports in late July.
What would change my mind: a clean Rheinmetall Q2 beat that re-anchors the €14-14.5 billion guide, a German supplementary budget that adds to 2026 outlays, or a sustained Iran war escalation that pushes oil above $120 and re-rates the entire basket. Absent those catalysts, the dispersion plays out.
A note for French readers on PEA eligibility
For readers holding a PEA (Plan d’Épargne en Actions), one name in this basket is off-limits. BAE Systems is listed in London and post-Brexit UK stocks are no longer PEA-eligible. If you want BAE exposure, it has to sit in a CTO (compte-titres ordinaire) and you accept the flat tax on gains and dividends.
Everything else discussed in this piece is PEA-eligible. Rheinmetall (Germany), Thales (France), Leonardo (Italy), Dassault Aviation (France), Hensoldt (Germany), Saab (Sweden), and Kongsberg (Norway, EEA with a tax treaty) all qualify under the EU/EEA rule. If you want defense exposure inside the PEA wrapper, the cheaper end of the dispersion (Leonardo, Thales, Dassault) also happens to map onto PEA-eligible names. That is a useful coincidence, not a recommendation.
See my full PEA guide (in French) for the eligibility framework and fiscal treatment.
Disclaimer
This article is educational content and does not constitute financial advice, investment advice, or a solicitation to buy or sell any security. All figures are sourced from public company filings and financial press as of April 21, 2026, and prices may have moved since publication. Defense stocks carry specific geopolitical and execution risks that may be material for your personal situation. You are responsible for your own investment decisions. If you are unsure, consult a regulated financial advisor.
Keep Reading
- TotalEnergies at €79: Betting on Brent: another European blue chip where geopolitics and execution collide. Similar thesis structure, different sector.
- BNP Paribas Q1 2026: The Sanctions Tail Risk: a European financial thesis built on the same “cheap multiple, geopolitical overlay” pattern.
- ASML Stock Review 2026: the deeper dive format. If you want the full 5,000-word treatment of a single European name, start here.
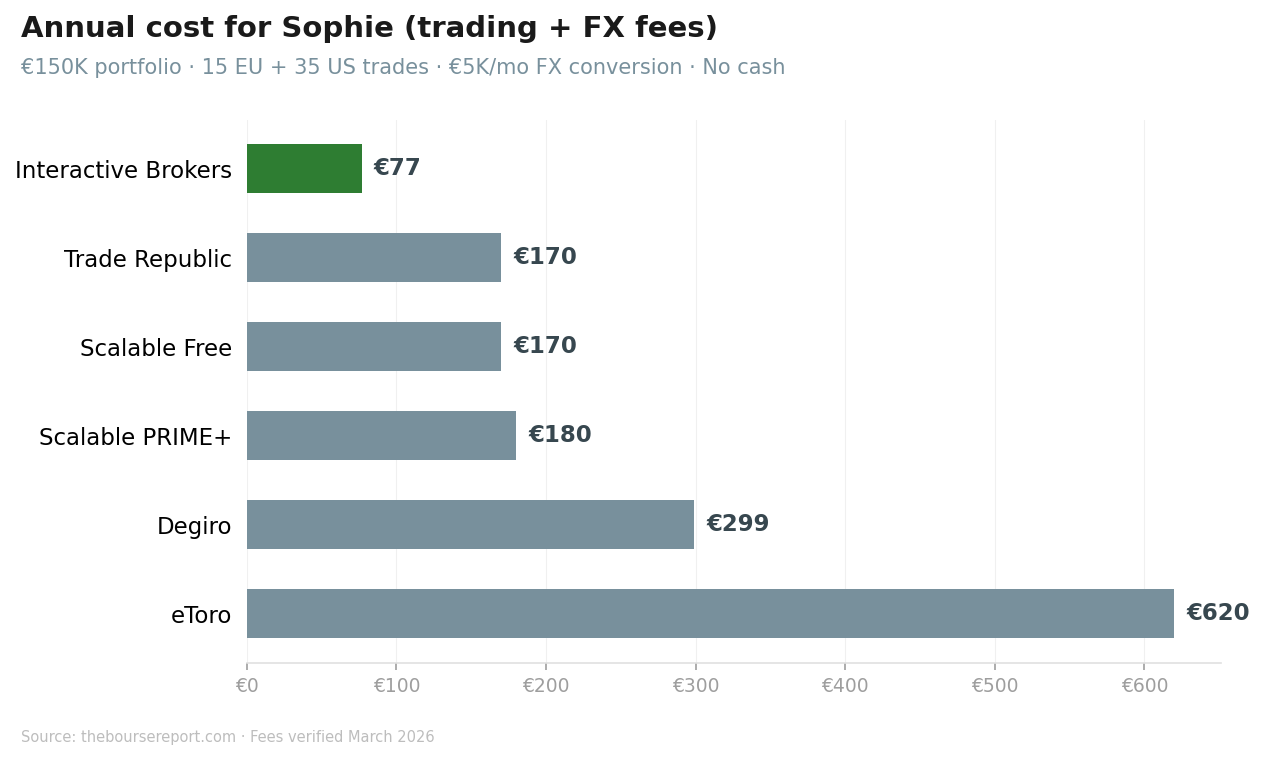
- Best Brokers in Europe 2026: if this article makes you want to buy one of these names, this is the comparison that helps you pick the right account first.