What is an ETF? An ETF (exchange-traded fund) is a basket of investments that trades on the stock exchange like a single stock. You buy one share and own a slice of dozens, hundreds, or thousands of companies. If you invest from Europe, though, there is more to know than most beginner guides cover: UCITS rules, accumulating versus distributing structures, synthetic replication, and how to decode those long, confusing fund names.
Key Takeaways
- An ETF is a fund that tracks an index (like the S&P 500 or MSCI World) and trades on a stock exchange. You buy and sell it through your broker, the same way you would a stock.
- European investors must buy UCITS ETFs: funds that comply with EU investor protection rules. You cannot buy US-domiciled ETFs (like SPY or VOO) due to the PRIIPs regulation.
- The choice between accumulating and distributing ETFs matters for taxes. Accumulating ETFs reinvest dividends automatically; distributing ETFs pay them out as cash. In most European countries, accumulating is more tax-efficient.
- ETFs cost a fraction of what active funds charge. A typical UCITS index ETF charges 0.07%–0.25% per year. The average actively managed European fund charges 1.5%–2.0%. Over 30 years, that difference compounds into tens of thousands of euros.
- You can start buying ETFs from a European brokerage account with as little as €1 (fractional shares) or around €50–100 for a full share of most broad index ETFs.
How an ETF Works
Think of an ETF as a container. Inside the container sit the actual investments: stocks, bonds, commodities, or a mix. The container itself is listed on a stock exchange with its own ticker symbol and price. You can buy or sell it anytime the exchange is open.
Most ETFs are index funds. They do not try to pick winners. Instead, they copy a specific index, a predefined list of companies weighted by market capitalisation. The MSCI World index, for example, contains around 1,300 companies from 23 developed countries. An ETF tracking the MSCI World holds shares in all of those companies in the same proportions. When the index changes its composition, the ETF adjusts automatically.
This is different from an actively managed fund, where a fund manager decides what to buy and sell. The manager charges higher fees for this service. The track record is poor: the S&P SPIVA Europe scorecard shows that over 15 years, more than 70% of active European equity funds fail to beat their benchmark index. ETFs remove the fund manager and the fees that come with them.
The creation and redemption mechanism
Large institutional players called Authorised Participants (APs) can create new ETF shares by delivering baskets of the underlying stocks to the fund provider, or redeem ETF shares in exchange for those stocks. This arbitrage mechanism keeps the ETF’s market price aligned with the value of its holdings (the net asset value, or NAV). When the ETF price drifts above NAV, APs create new shares and push the price down. When it drops below, they redeem shares and push it up. The practical effect: you pay close to fair value for an ETF at any given moment.
Why European Investors Must Buy UCITS ETFs
If you are based in the EU or EEA, you need to know one acronym: UCITS. It stands for Undertakings for Collective Investment in Transferable Securities, which is as opaque as it sounds. In practice, UCITS is the EU’s regulatory framework for investment funds sold to retail investors. It sets rules on diversification, transparency, and investor protection.
A UCITS ETF must:
- Publish a Key Information Document (KID) in the local language of each country where it is sold
- Limit single-stock exposure to no more than 10% of the fund, and all positions above 5% combined cannot exceed 40%
- Hold fund assets separately from the provider’s own assets (so if iShares or Vanguard went bankrupt, your money in the ETF would be ring-fenced)
- Report regularly on holdings, costs, and performance
The EU’s PRIIPs regulation requires that any “packaged” investment product sold to retail investors comes with a KID. US-domiciled ETFs (like SPY, VOO, or QQQ) do not produce KIDs. European brokers are legally required to block you from buying them.
Every major US index has a UCITS equivalent. The S&P 500 has the iShares Core S&P 500 UCITS ETF (CSPX) and the Vanguard S&P 500 UCITS ETF (VUAA). The NASDAQ-100 has the iShares NASDAQ 100 UCITS ETF (CNDX). For global exposure, there is the Vanguard FTSE All-World UCITS ETF (VWCE). These funds are domiciled in Ireland or Luxembourg, comply with all EU rules, and trade on European exchanges like Xetra, Euronext, and Borsa Italiana.
Our guide on how to buy US stocks in Europe covers this distinction further, including why individual US stocks are not affected by PRIIPs.
Accumulating vs Distributing ETFs
This is the most European-specific decision you will make as an ETF investor. Most global guides skip it because it barely matters in the US.
When companies inside an ETF pay dividends, the fund collects them. What happens next depends on the ETF structure:
- Distributing ETFs (sometimes marked “Dist” or “D”) pay those dividends out to you as cash, typically quarterly or semi-annually. You see the money arrive in your brokerage account.
- Accumulating ETFs (marked “Acc” or “C”) reinvest the dividends back into the fund automatically. No cash hits your account. Instead, the ETF’s share price grows slightly faster because the dividends are compounding inside the fund.
The reason this matters is taxation.
In most European countries, dividends paid out to you are taxed as income in the year you receive them. If you hold a distributing ETF that pays €500 in dividends and your country taxes dividends at 26% (Italy), 30% (Belgium, France via the PFU), or 26.375% (Germany including Solidaritätszuschlag), you owe that tax immediately. Even if you plan to reinvest the dividends yourself, you pay tax first, then reinvest what is left.
An accumulating ETF avoids this drag in most countries. The dividends never reach you. They stay inside the fund. You only face tax when you eventually sell your shares, and that is typically taxed as a capital gain, which may carry a lower rate or qualify for exemptions depending on your country and how long you held.
There are exceptions. Germany applies a Vorabpauschale (advance lump sum) to accumulating funds, creating a small annual tax even without distributions. Belgium as of January 2026 taxes capital gains on financial assets at 10% above a €10,000 annual exemption. But the general principle holds: accumulating ETFs offer tax deferral, which means more of your money compounds for longer.
Our view: If you are investing for the long term (10+ years) and do not need dividend income now, choose accumulating. If you want regular cash flow, perhaps in retirement, distributing makes sense. Check your country’s specific tax treatment before deciding.
Physical vs Synthetic Replication
An ETF can hold the investments it tracks in two ways.
Physical replication (also called “direct” replication): The ETF buys and holds the actual stocks or bonds in the index. A physically replicated S&P 500 ETF owns shares of Apple, Microsoft, Amazon, and every other company in the index. Most large ETFs use this method. A variant called optimised sampling holds a representative subset of the index (useful when the full index has thousands of tiny positions).
Synthetic replication: The ETF does not hold the underlying stocks directly. Instead, it enters into a swap agreement with a counterparty bank. The bank promises to deliver the index return, and the ETF holds a basket of collateral. This introduces counterparty risk: if the swap counterparty defaults, the ETF relies on its collateral. UCITS rules limit uncollaterlised swap exposure to 10% of NAV.
When does synthetic make sense? For hard-to-access markets, for certain commodity exposures, or when it can reduce tracking error and withholding tax drag. Some synthetic ETFs on US indices achieve better after-tax returns than physical ones because the swap structure avoids the 15% US dividend withholding tax that even Irish-domiciled physical ETFs pay at the fund level.
For most European beginners: physical replication is the default choice. It is simpler, more transparent, and the counterparty risk question does not apply. Look at synthetic only if you understand why it might deliver a better net return for your specific situation.
How to Read an ETF Name
ETF names look like alphabet soup. They follow a pattern, though. Take a real example:
iShares Core MSCI World UCITS ETF USD (Acc)
- iShares — the provider (BlackRock’s ETF brand)
- Core — the product line (iShares uses “Core” for its cheapest, broadest funds)
- MSCI World — the index the ETF tracks
- UCITS — confirms compliance with EU regulation
- ETF — it is an exchange-traded fund
- USD — the fund currency (the currency in which the fund’s NAV is calculated, not necessarily the currency you buy it in)
- (Acc) — accumulating structure (dividends reinvested)
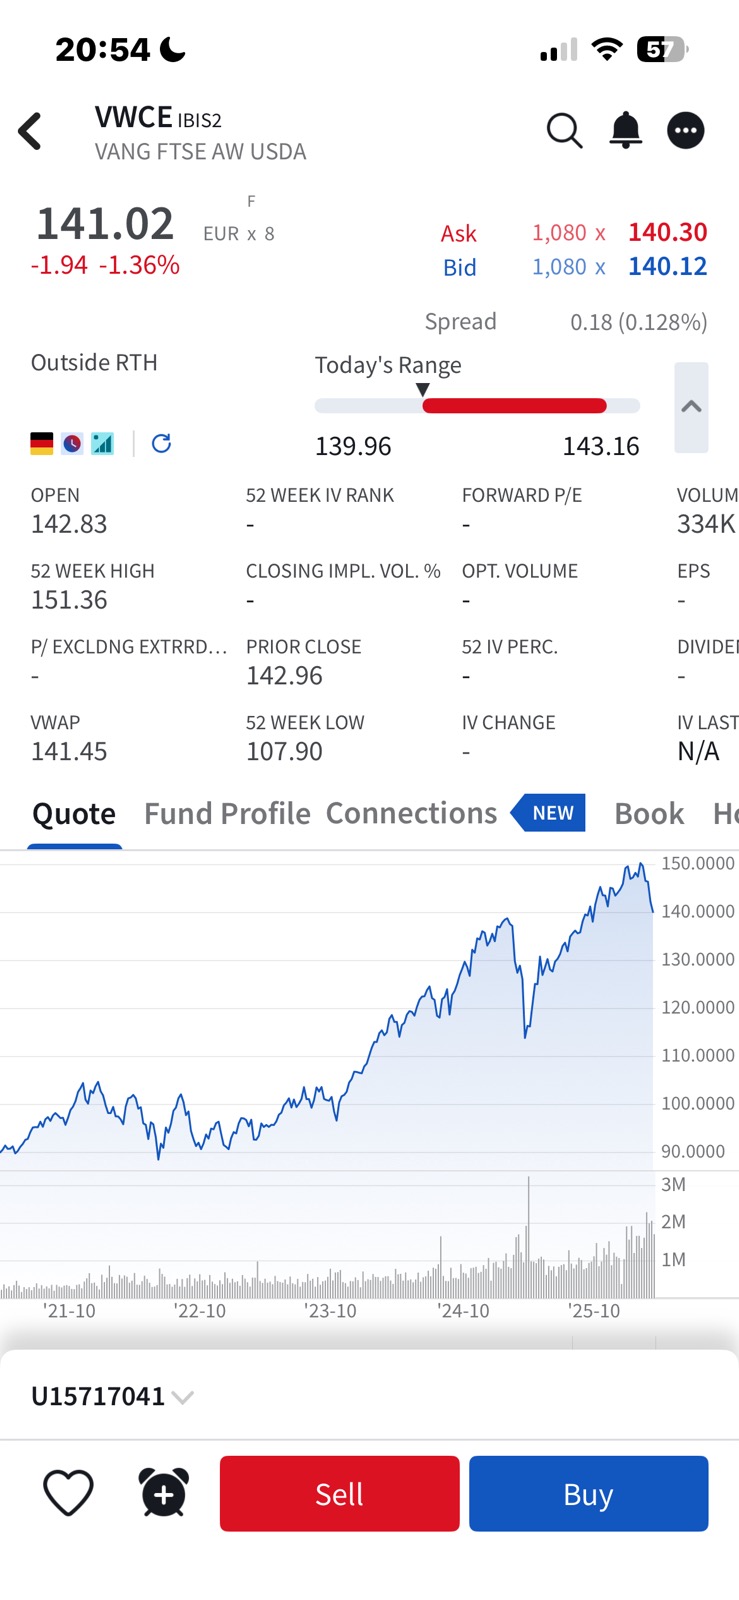
VWCE on IBKR’s mobile app. The header reads “VWCE IBIS2” — that tells you the ticker (VWCE) and the exchange (IBIS2, which is Xetra). Below: price, bid-ask spread, and key stats.
The same ETF might trade on multiple exchanges under different tickers: IWDA on Euronext Amsterdam (in USD), SWDA on London Stock Exchange (in USD), EUNL on Xetra (in EUR). These are all the same fund. You are choosing which exchange and currency to trade in. The underlying holdings are identical.
Every UCITS ETF also has an ISIN (International Securities Identification Number) that uniquely identifies it regardless of exchange or ticker. For the fund above, the ISIN is IE00B4L5Y983. When you are comparing ETFs, the ISIN removes all ambiguity.
What an ETF Costs
ETF costs come in layers. Knowing them prevents surprises.
TER (Total Expense Ratio)
The TER is the annual fee the fund charges, expressed as a percentage of your investment. It is deducted automatically from the fund’s value. You never see a bill. A broad MSCI World UCITS ETF typically charges 0.10%–0.20% per year. An S&P 500 UCITS ETF can be as low as 0.03%–0.07%. Compare this to the average European actively managed equity fund at 1.5%–2.0%.
To put this in euros: on a €10,000 investment, a 0.12% TER costs you €12 per year. A 1.5% active fund fee costs €150. Over 30 years with compounding, that gap grows to tens of thousands of euros on a six-figure portfolio.
Tracking difference
The TER does not tell the full cost story. Tracking difference measures the actual gap between the ETF’s return and the index’s return over a given period. An ETF with a 0.20% TER might have a tracking difference of only 0.10% (because it earns revenue from securities lending) or 0.30% (because of transaction costs and withholding taxes). Tracking difference is the more honest cost measure, and you can find it on fund factsheets or on justETF or trackingdifferences.com.
Trading costs
These are broker fees, not fund fees. Every time you buy or sell an ETF, you pay a commission to your broker (anywhere from €0 to €3 depending on the broker and platform) plus a bid-ask spread (the small gap between the buy and sell price). For large, liquid ETFs like VWCE or CSPX, the spread is small, often 0.01%–0.05%. For niche or small ETFs, the spread can be wider.
We compared broker costs in detail in our best brokers for European investors guide.
Types of ETFs
Not every ETF is a broad stock market index fund. The main categories break down as follows.
Equity index ETFs (the core)
The most popular for European investors track MSCI World (developed markets), FTSE All-World (developed + emerging), S&P 500 (US large cap), and MSCI Emerging Markets. If you are building a simple long-term portfolio, one or two of these form the backbone.
Bond ETFs
Bond ETFs hold government bonds, corporate bonds, or a mix. They add stability and income to a portfolio. European investors often look for euro-hedged versions to avoid currency risk, or euro-denominated government bond ETFs.
Thematic and sector ETFs
Sector and thematic ETFs target specific areas (technology, healthcare, clean energy) or investment themes (artificial intelligence, cybersecurity, ageing population). They concentrate your bets, and costs tend to be higher: 0.30%–0.65% TER is common. Useful as satellite positions, not as your core.
Dividend ETFs
Dividend ETFs track indices of high-dividend-paying companies. Popular in Europe for income-focused investors, but watch for the tax implications discussed in the accumulating vs distributing section above.
Multi-asset ETFs
Some ETFs combine stocks and bonds in a single fund, like the Vanguard LifeStrategy UCITS ETFs (available in 20/40/60/80% equity versions). These are one-fund portfolios that rebalance automatically.
ETF vs Mutual Fund vs Stock: When to Use Each
For most European investors building long-term wealth, ETFs are the default tool. Individual stocks are for people who want to actively research specific companies (we write stock reviews for those who do). Active mutual funds have lost ground to ETFs for years, and the data explains why.
How to Buy Your First ETF in Europe
Four steps, nothing complicated.
1. Open a brokerage account
You need a broker that gives you access to European exchanges (Xetra, Euronext, Borsa Italiana, etc.) where UCITS ETFs trade. The main options for European investors are Interactive Brokers, Degiro, Trade Republic, and Scalable Capital. We compared them all in our best brokers guide.
2. Decide on your ETF
For a first ETF, keep it simple. A single global equity index ETF gives you exposure to the entire developed world. The two most popular choices among European investors:
- iShares Core MSCI World UCITS ETF (Acc) — ISIN: IE00B4L5Y983, TER: 0.20%, tracks ~1,300 companies in 23 developed countries
- Vanguard FTSE All-World UCITS ETF (Acc) — ISIN: IE00BK5BQT80, TER: 0.19%, tracks ~4,200 companies in developed + emerging markets
Both are accumulating, physically replicated, and domiciled in Ireland. Either one works as a core holding for a long-term portfolio.
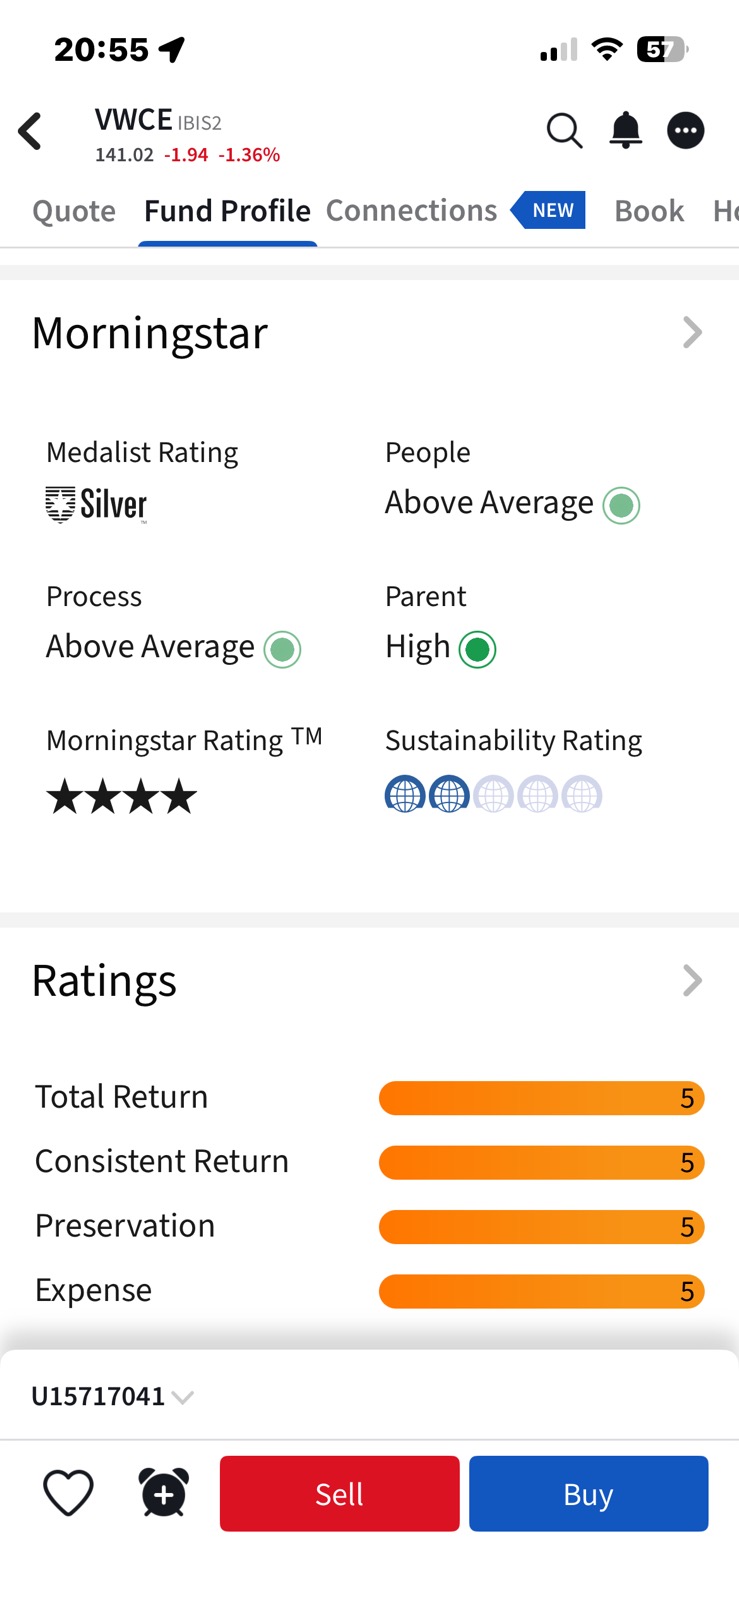
The Fund Profile tab for VWCE inside IBKR. Morningstar rates it Silver with 4 stars. You can check ratings like these before buying to compare funds.
3. Place your order
Search for the ETF by ISIN or ticker in your broker’s platform. Select the exchange you want to trade on (Xetra is the most liquid for many UCITS ETFs traded in EUR). Place a limit order at or near the current price. The trade settles in T+2 (two business days).
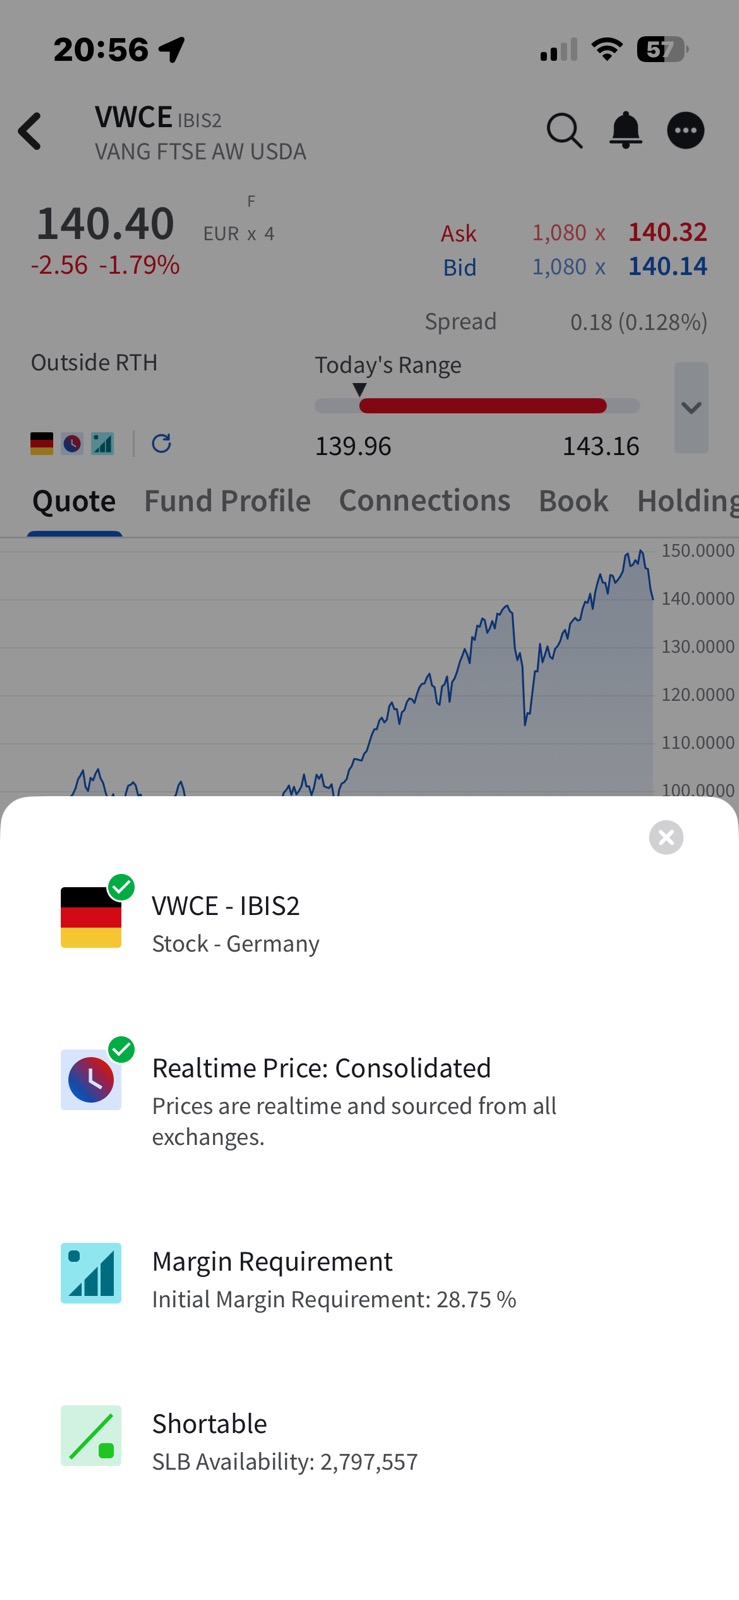
Example: buying VWCE on Interactive Brokers. In the IBKR Client Portal or mobile app, type “VWCE” or the ISIN (IE00BK5BQT80) in the search bar. IBKR will show you multiple listings — pick the one on Xetra (IBIS2) if you want to trade in EUR. Click Trade, select Buy, enter the number of shares (or use the order value field for a euro amount). Set the order type to Limit, enter a price at or slightly above the current ask, and submit. IBKR charges 0.05% of the trade value on Xetra, with a minimum of €1.25 and a maximum of €29 — so a €5,000 ETF purchase costs you €2.50 in commission. The shares appear in your portfolio within seconds, and settlement completes in two business days. For a detailed walkthrough, see our IBKR review.
VWCE on IBKR, showing the live quote and price chart. The spread of 0.18 (0.128%) tells you this is a liquid ETF with tight trading costs.
4. Automate if possible
Several European brokers offer savings plans (Sparpläne in German) that automatically buy a fixed euro amount of your chosen ETF every month. Trade Republic and Scalable Capital offer these for free on many ETFs. Degiro offers a selection of commission-free ETFs. Automation removes emotion and builds the habit of consistent investing.
Common Mistakes European ETF Investors Make
Overcomplicating the portfolio
You do not need 10 ETFs. A single global equity ETF covers over 1,300 companies across all sectors and geographies. Adding a second ETF for bonds or emerging markets is reasonable. Beyond that, every extra fund adds rebalancing work with diminishing diversification benefit. Many European investors hold one or two ETFs for their entire portfolio.
Chasing past performance
The thematic ETF that returned 40% last year might lose 30% next year. Broad indices are boring by design, and boring compounds well.
Ignoring the tax implications of distributing ETFs
Choosing a distributing ETF in a country with high dividend taxation means you lose a chunk of every dividend payment to tax, even if you reinvest. Check whether accumulating makes more sense in your tax jurisdiction before buying.
Buying the wrong share class
The same ETF can have an accumulating and a distributing version, an EUR-hedged and an unhedged version, and trade on multiple exchanges. Always verify the ISIN before you buy. The name alone is not enough. Two different ISINs can have very similar names but different structures.
Trading too often
ETFs trade like stocks, which makes it tempting to buy and sell based on market movements. Resist. Transaction costs, bid-ask spreads, and the tax events triggered by selling all eat into your returns. The optimal strategy for most people is to buy regularly and not sell for decades.
Frequently Asked Questions
Is an ETF safer than a stock?
An ETF is more diversified than a single stock, which reduces the risk of one company destroying your portfolio. But ETFs still carry market risk. If the entire stock market drops 30%, your MSCI World ETF drops roughly 30% too. Diversification protects against company-specific risk, not market risk.
Can I lose all my money in an ETF?
For a broad index ETF to go to zero, every company in the index would have to go bankrupt simultaneously. This has never happened. Individual stocks can go to zero. Broad ETFs cannot, practically speaking. That said, they can and do lose significant value during market downturns: a 40%–50% drawdown is within the historical range for equity indices.
What is the minimum amount to invest in an ETF?
The price of one share. For the Vanguard FTSE All-World UCITS ETF, that is roughly €110–130. Some brokers like Trade Republic and Interactive Brokers offer fractional shares, allowing you to invest as little as €1. Monthly savings plans on many European brokers start from €1–25.
Should I buy an ETF in EUR or USD?
The trading currency does not affect your returns. Whether you buy IWDA in USD on Euronext Amsterdam or EUNL in EUR on Xetra, the underlying holdings are identical. Your real currency exposure is to the currencies of the companies in the index (mostly USD for an MSCI World ETF). The only difference is whether your broker needs to convert your EUR to USD before the trade, which may incur an FX fee. Buying in EUR on Xetra avoids that step.
How are ETFs taxed in Europe?
There is no single EU-wide tax treatment. Each country has its own rules for capital gains, dividends, and sometimes special provisions for ETFs (like Germany’s Vorabpauschale or France’s PEA wrapper). The general principle: you owe tax in your country of residence when you sell (capital gains) and possibly when you receive distributions. Consult your local tax authority or a tax advisor for specifics.
What happens to my ETF if the provider (iShares, Vanguard) goes bankrupt?
UCITS rules require that fund assets are held by an independent custodian (a large bank like State Street or BNP Paribas), separate from the fund provider. If iShares or Vanguard went under, the ETF’s holdings would still exist at the custodian. The fund would be liquidated or transferred to a new provider, and you would receive the value of your shares. Your investment is not lost.
Disclaimer: This article is for informational purposes only and does not constitute investment, tax, or legal advice. ETFs carry market risk, including the potential loss of principal. Tax treatment depends on your individual circumstances and country of residence. Always consult a qualified advisor before making investment decisions.
Some links in this article are affiliate links. If you open an account through these links, The Bourse Report may receive a commission, at no extra cost to you. See our full affiliate disclosure.